
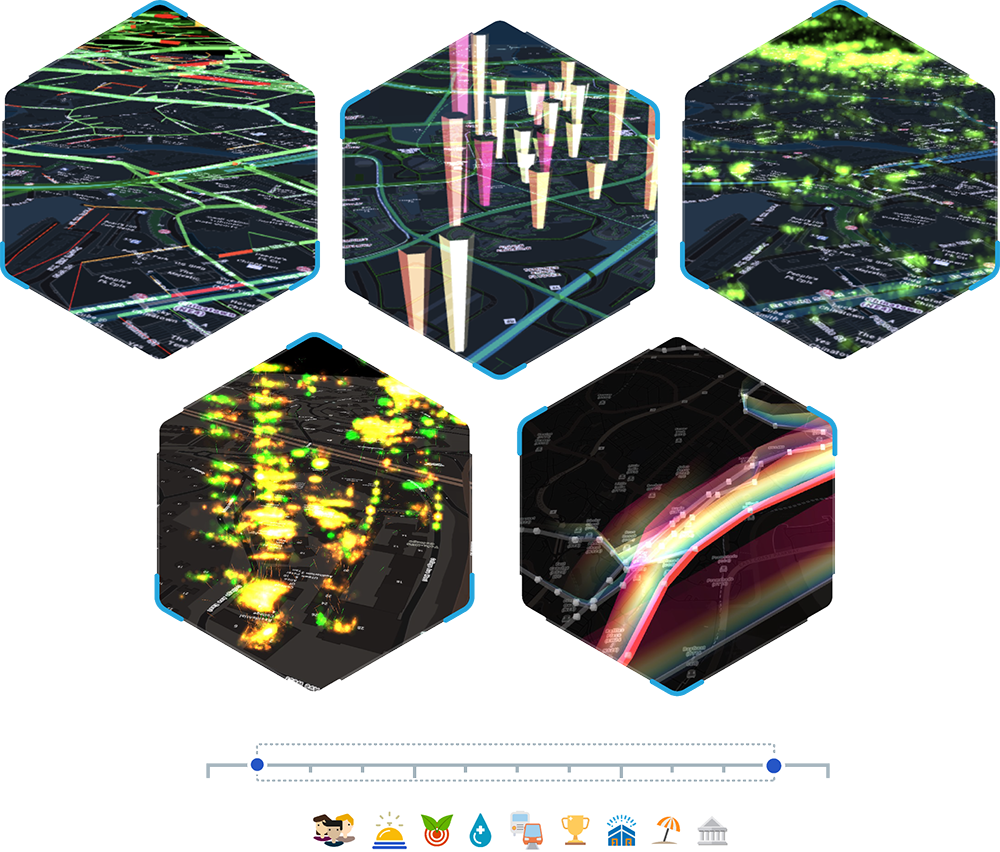
MAPVISUALS is a 3D Data Visualization platform for city-scale geospatial, temporal datasets. Powered by webGL 3D graphics rendering, it serves as a visual analytics platform for data aggregation, hotspot identification, optimization, planning and reviewing.
Check out the video preview and more from our SSI@NUS corporate video.
Access the MapVisuals dashboard (Preview Version, Alpha) here!